Round 3: Everything Implosion
- MAC10

- Aug 9, 2024
- 2 min read
In this end of week post I will focus on the technicals of the market with a small amount of macro commentary.
First off, it was a highly volatile week but in my view the vector of this collapse now all comes down to positioning. My view is that bulls are badly positioned and bears are badly positioned as well because they keep getting rinsed by these robo rallies. This is the second time we've seen this exact same movie in the past few weeks so I view this upcoming decline to be the third and most explosive round of action. In keeping with my Mega Crash hypothesis.
Here we see the S&P 500 with the VIX. At the all time high the VIX was down at 12 but hit 20 during the AI implosion and then settled back at 16 at the FOMC rally top last week ("AI Implosion"). On Monday of this week the VIX opened at 65 but it closed at 38 and now at the end of the week it's back at 20. So, each week it has gained 4 points on a closing basis. It's in an uptrend.
As I showed on Twitter, the oscillator is not oversold and in fact has rallied back to the same level it was at in April before the final low was made. Also, consider that the market has come all the way down below the prior high and yet is somehow still more overbought than it was at the Spring low. Which is shocking and testament to steady buying all the way down.
For Tech, things are more dire. This week saw the highest Nasdaq 100 (NDX) down volume in history. And as we see below, volume is trending higher along with the VIX. Meanwhile, the Tech sector is clinging to the 200 dma similar to the action at the 50 dma.
This chart zooms out on the Tech chart above shows the record down volume and also shows the diverging put/call ratio. Clearly, compared to other declines we have seen no capitulation despite record down volume. Which means that capitulation when it finally arrives will bring even higher down volume and dislocation than what we saw this week. I personally don't think that the system can handle total panic across all asset classes at the same time.
This is a new chart I created today. For those who follow Elliot Wave analysis, the consumer discretionary sector has the clearest wave count of any market. The blue numbers represent the smaller degree of trend and the red numbers are the larger trend. So this is wave '2' down (red) as the consumer sector failed to take out its 2021 high. Note that wave '1' (blue) is so far identical to wave '3' (blue) back in 2022 which was the steepest part of that decline.
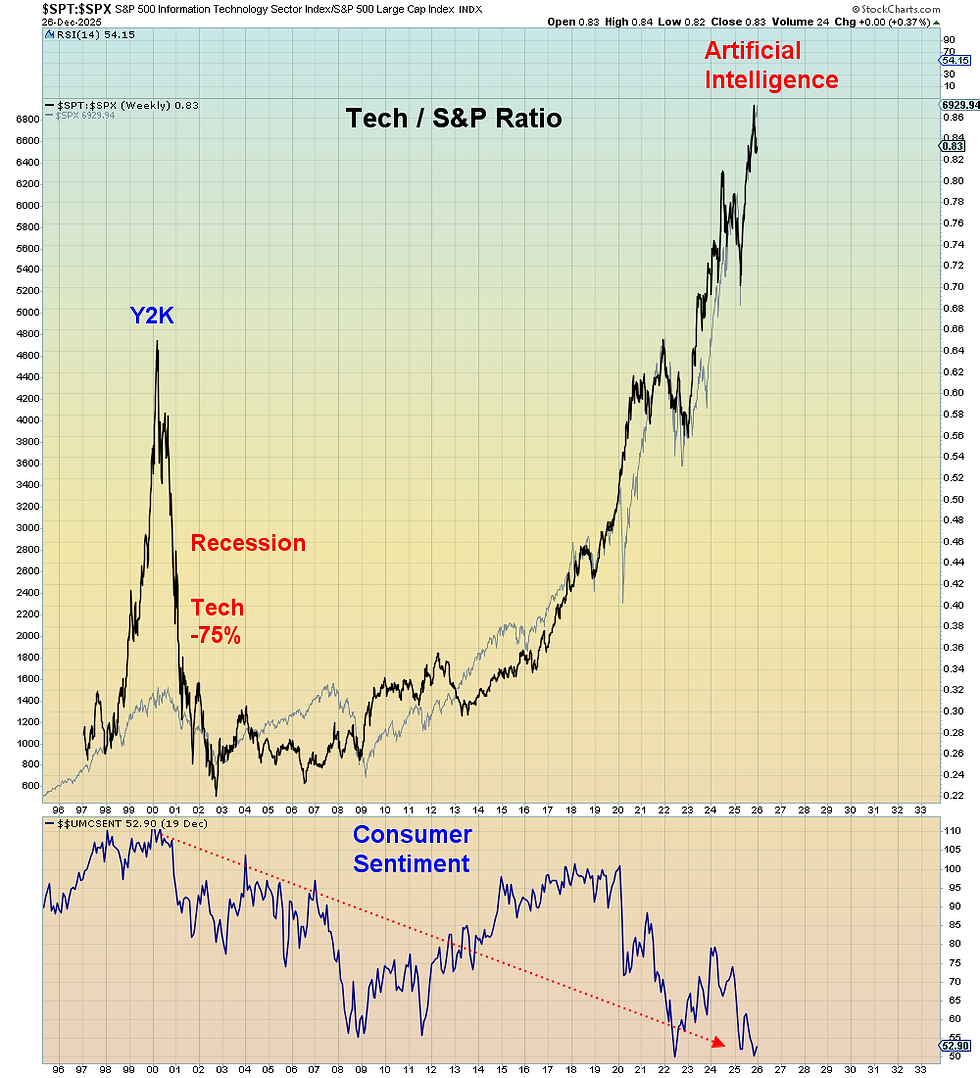
And of course from a macro perspective this chart merely confirms what consumer sentiment is telling us.
This last chart shows that Min Vol recession stocks are the last part of this market to implode and I predict that when they join the downside party we will be in the final and most dramatic phase of the Mega Crash, which is what I call the Everything Implosion.
Believe it. Or not.


